> ## Documentation Index
> Fetch the complete documentation index at: https://docs.phinite.ai/llms.txt
> Use this file to discover all available pages before exploring further.
# Insights and Sessions
> Observability KPIs, Cost (Phinite), and the Sessions list.
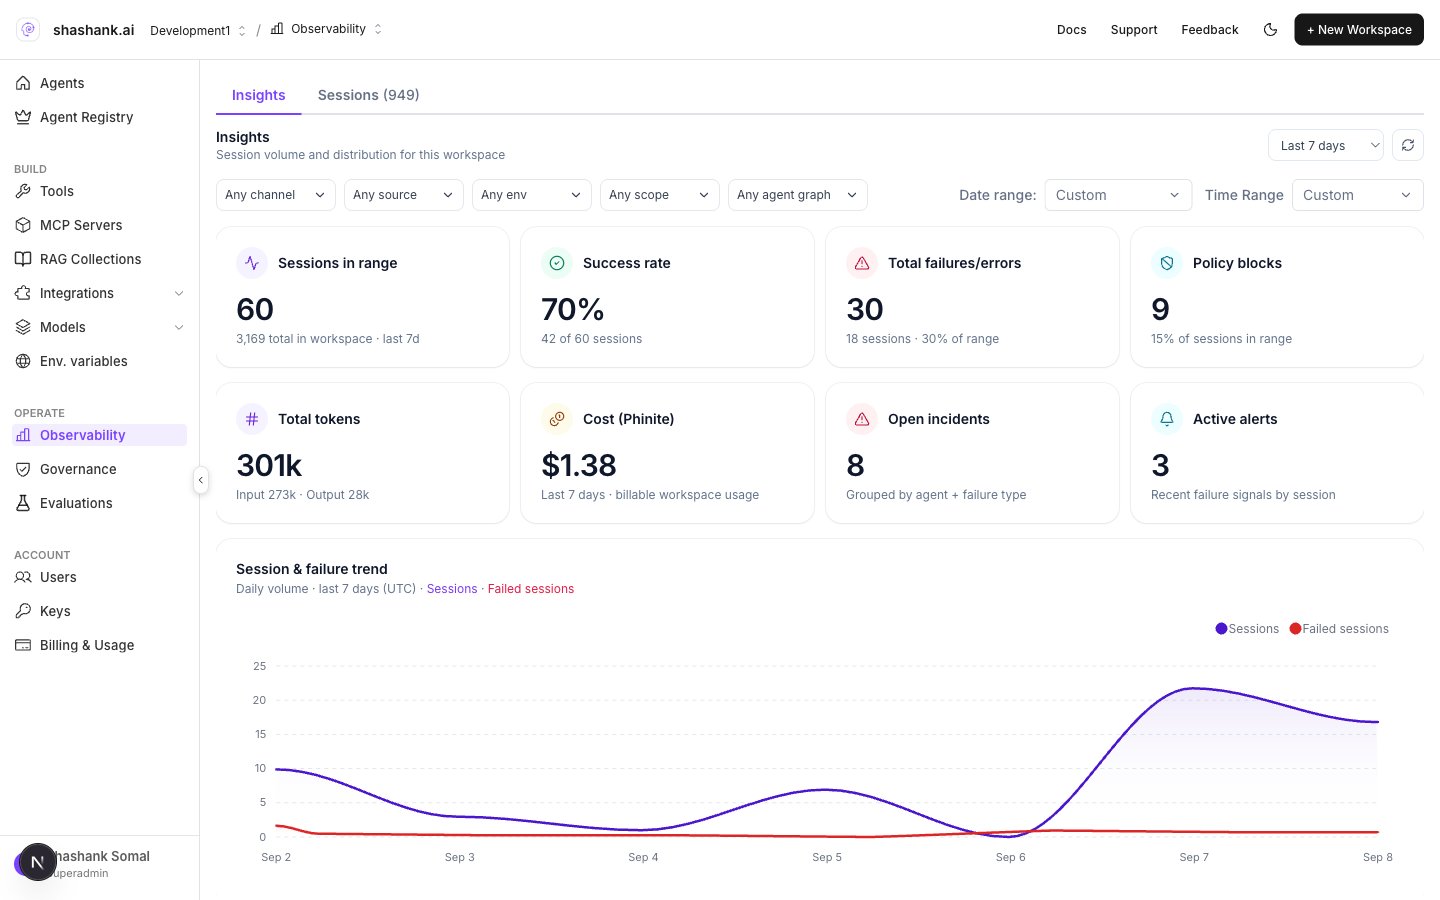
**Insights** is the default Observability landing. Use it to scan health, then open **Sessions** for the run list.
 ## Insights
### Range and filters
* Range: **Last 24 hours** · **Last 7 days** · **Last 30 days** · **Last 90 days**
* Filters: channel, source, env, scope, agent / flow
* **Refresh**
### KPI tiles
| Title | Meaning |
| ------------------------- | ------------------------- |
| **Sessions in range** | Count for the window |
| **Success rate** | Successful sessions share |
| **Total failures/errors** | Errors impacting sessions |
| **Policy blocks** | Governance denials |
| **Total tokens** | Input · Output |
| **Cost (Phinite)** | Billable platform usage |
| **Open incidents** | Grouped failure themes |
| **Active alerts** | Recent failure signals |
### Charts and lists
* **Session & failure trend** (**Sessions** · **Failed sessions**)
* **Agent health** (Agent, Health, Sessions, Success, P95, Cost / session, Alerts)
* **Failures & errors** breakdowns
* Breakdowns **By channel** / **By source** / **By environment** (click to filter Sessions)
## Sessions
Switch to **Sessions** (`?tab=sessions`) or drill from an Insights chart.
## Insights
### Range and filters
* Range: **Last 24 hours** · **Last 7 days** · **Last 30 days** · **Last 90 days**
* Filters: channel, source, env, scope, agent / flow
* **Refresh**
### KPI tiles
| Title | Meaning |
| ------------------------- | ------------------------- |
| **Sessions in range** | Count for the window |
| **Success rate** | Successful sessions share |
| **Total failures/errors** | Errors impacting sessions |
| **Policy blocks** | Governance denials |
| **Total tokens** | Input · Output |
| **Cost (Phinite)** | Billable platform usage |
| **Open incidents** | Grouped failure themes |
| **Active alerts** | Recent failure signals |
### Charts and lists
* **Session & failure trend** (**Sessions** · **Failed sessions**)
* **Agent health** (Agent, Health, Sessions, Success, P95, Cost / session, Alerts)
* **Failures & errors** breakdowns
* Breakdowns **By channel** / **By source** / **By environment** (click to filter Sessions)
## Sessions
Switch to **Sessions** (`?tab=sessions`) or drill from an Insights chart.
 ### Columns
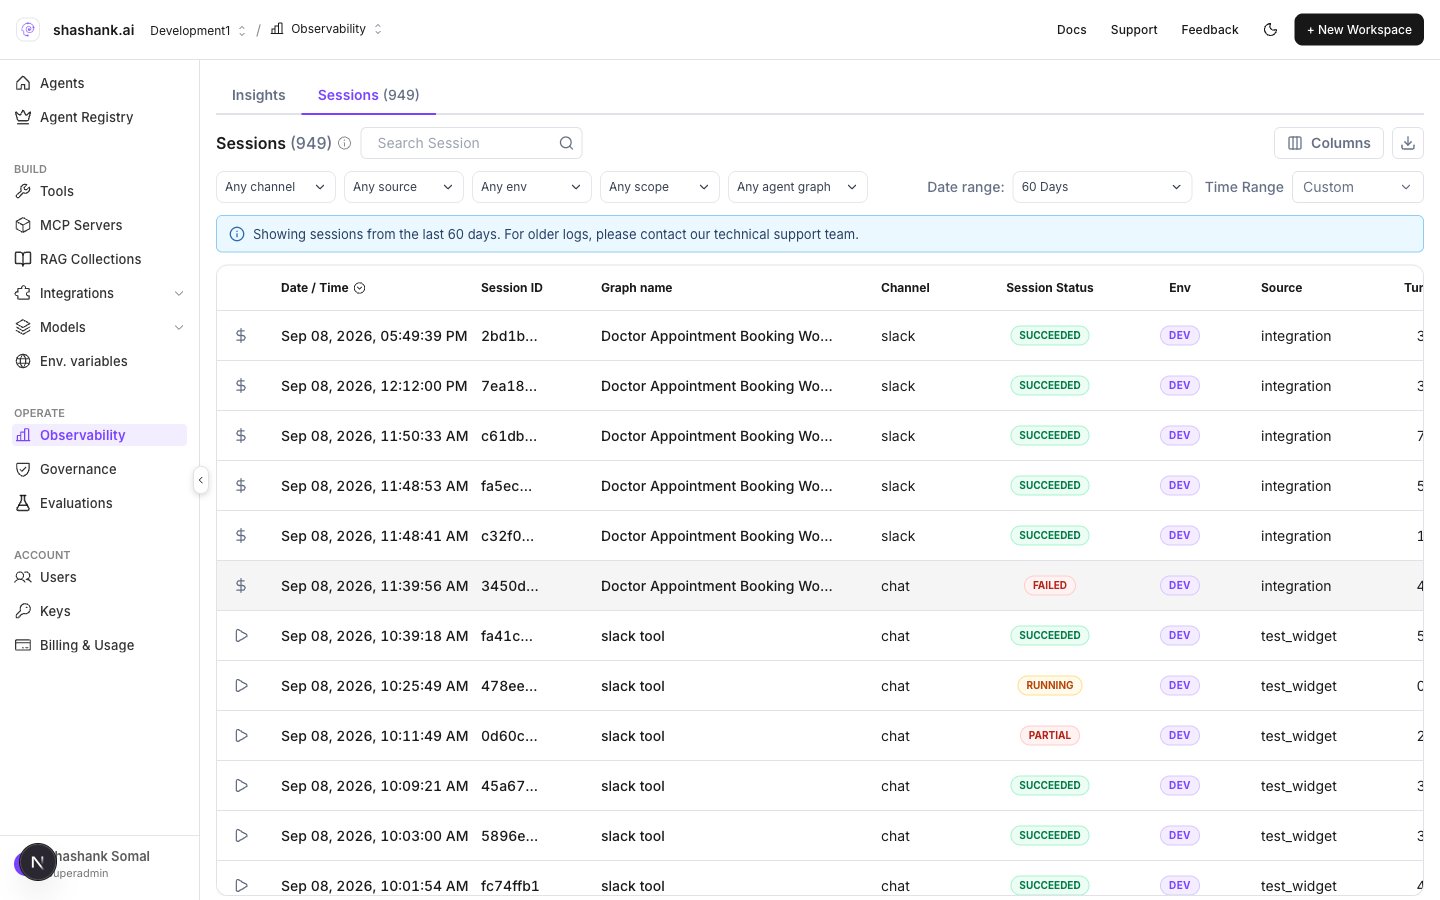
**Date / Time** · **Session ID** · **Graph name** · **Channel** · **Session Status** · **Env** · **Source** · **Turns** · **Duration** · **Cost** · **Eval score** · **Scope**
Open a row for that session’s log detail. Export zip is available when enabled in the UI.
## Related
* [Observability overview](/observability/overview)
* [Governance approvals](/governance/approvals)
* [Evaluations](/evaluations/overview)
### Columns
**Date / Time** · **Session ID** · **Graph name** · **Channel** · **Session Status** · **Env** · **Source** · **Turns** · **Duration** · **Cost** · **Eval score** · **Scope**
Open a row for that session’s log detail. Export zip is available when enabled in the UI.
## Related
* [Observability overview](/observability/overview)
* [Governance approvals](/governance/approvals)
* [Evaluations](/evaluations/overview)